Bitcoin, Ethereum, XRP News: $800 Million Crypto Liquidation

⚡ Quick Takeaways:
- Bitcoin price is stabilizing above the 50-day EMA, but negative ETF flows signal caution.
- Ethereum sees continued ETF inflows despite struggling to maintain its uptrend.
- XRP experiences intensified selling pressure, trimming previous gains amid mixed market sentiment.
- Roughly $800 million in long positions were liquidated across the market, a reminder of how quickly leverage can amplify a downturn.
The cryptocurrency industry is experiencing a mixed bag of signals as we approach January 19. A staggering $800 million in long positions were liquidated across the cryptocurrency market, triggered by escalating trade war fears and a resulting risk-off sentiment. Bitcoin, Ethereum, and XRP are all showing signs of strain, pausing their recent uptrends amid mixed ETF flows and lingering negative sentiment.
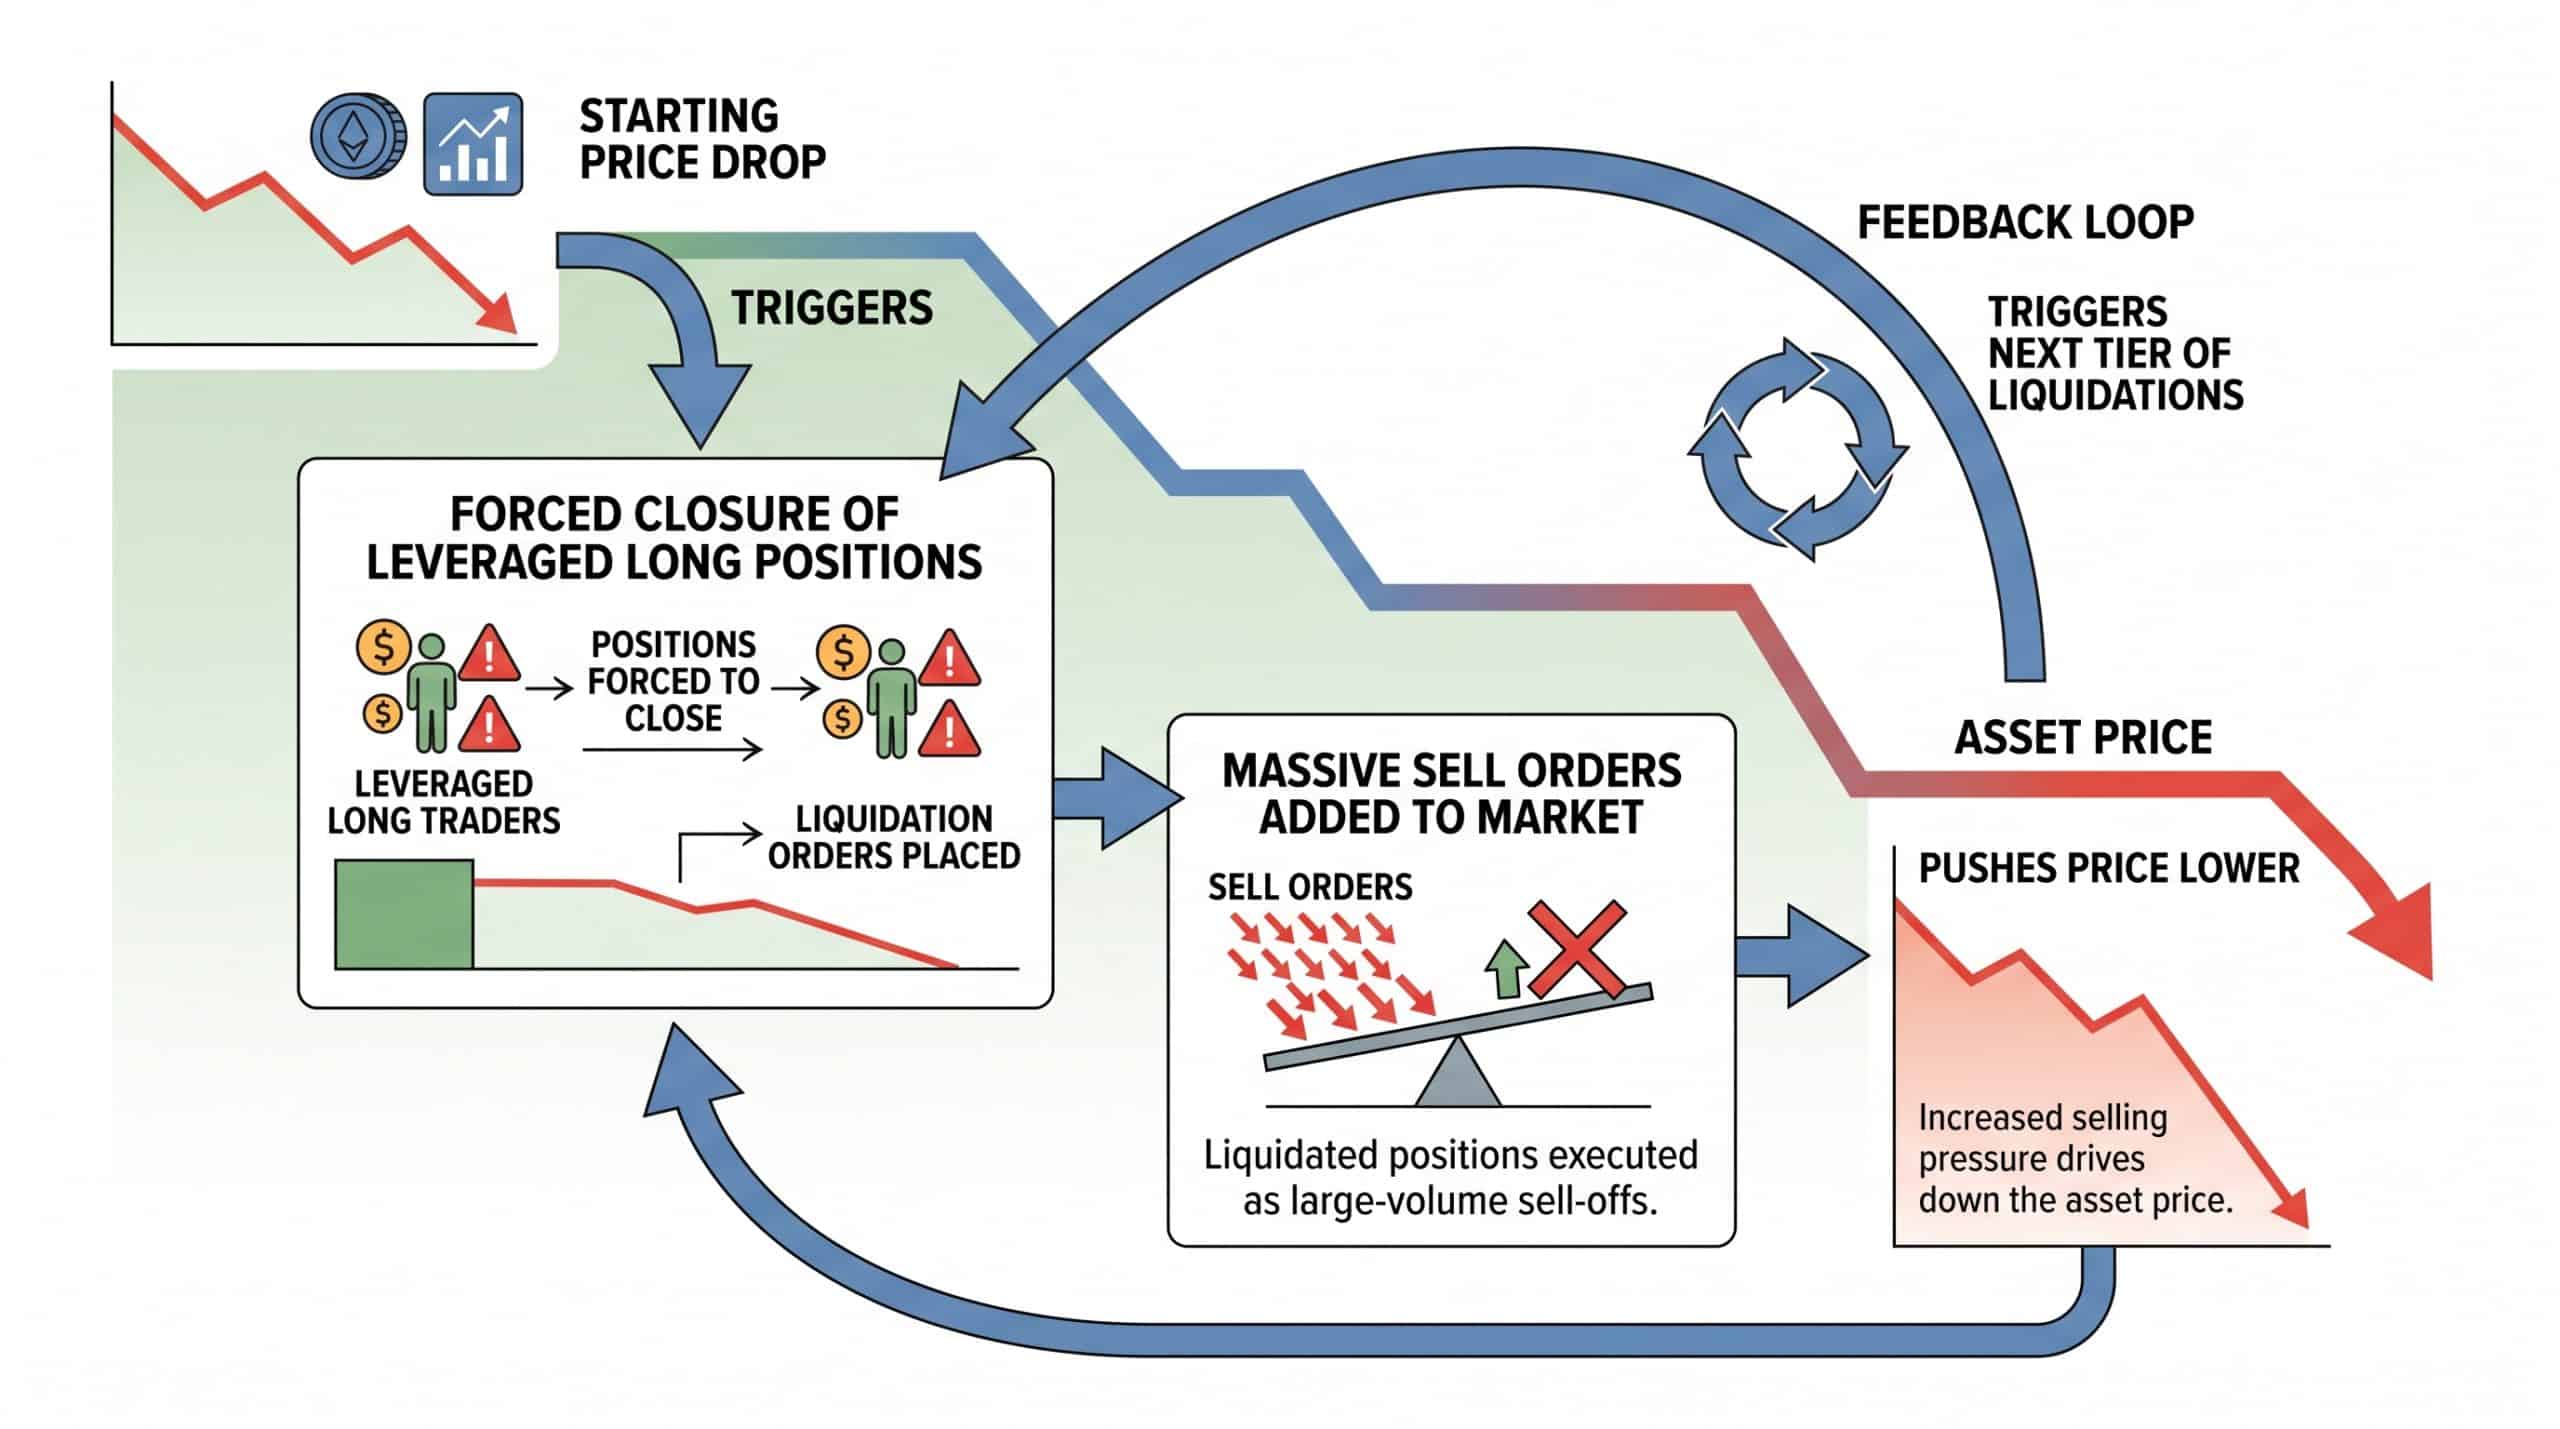
Liquidations of this size are not ordinary selling. When leveraged long positions are forcibly closed, the resulting sell orders hit the market regardless of price, which can turn a routine dip into a sharp, self-reinforcing decline. That dynamic sits behind much of the volatility described below, and it is why traders watch support levels, momentum indicators, and ETF flows so closely during stretches like this one. This article dives deep into the recent price action and market analysis, providing context and insights for investors navigating these uncertain times.
Bitcoin Price Analysis: BTC Tests Key Support Levels
Bitcoin (BTC) is currently trading under pressure, extending its correction toward the $92,000 support level. Bitcoin broke below key levels as selling intensified. The recent price dip comes after Bitcoin reached new highs, fueled by early trading enthusiasm and strong ETF inflows. However, recent ETF outflows have created headwinds, leading to a pullback.
The Relative Strength Index (RSI) on the daily chart has declined to 60, indicating fading bullish momentum. The RSI tracks the speed and magnitude of recent price moves, and a reading that slips back toward the midline after an extended rally typically signals that buyers are losing their grip on the trend even though sellers have not taken full control. That is the picture on Bitcoin’s daily chart right now: momentum is cooling rather than collapsing.
Despite the 50-day EMA providing some support around $91,784, a break below this level could trigger a further sell-off toward $90,000. Exponential moving averages weight recent prices more heavily than older ones, which makes them a popular way to track where the short- and medium-term trend actually sits. When price holds above a rising EMA, trend followers tend to stay committed; when it closes decisively below, stop-losses and momentum strategies can add to the selling.
The Moving Average Convergence Divergence (MACD) indicator maintains a positive divergence, which could incentivize traders to increase their long positions, adding a potential tailwind. A sustained close above the 50-day EMA would reaffirm a short-term bullish outlook, while pushing beyond the 100-day EMA at $96,584 could signal an extended uptrend toward $100,000.
The practical takeaway is that Bitcoin is boxed in between its major moving averages. Holding the 50-day EMA keeps the constructive scenario alive; losing it shifts attention to the round-number support below, where the market’s willingness to absorb forced selling will be tested.
Ethereum Price Action: ETH Struggles to Resume Uptrend
Ethereum (ETH) is trading under pressure, retreating from an intraday high of $3,299 to around $3,220. The 100-day EMA caps the upside at $3,307, while the 200-day EMA emphasizes resistance at $3,352. That moving average cluster between $3,307 and $3,352 is the zone bulls need to reclaim before any sustained recovery can develop.
Despite ETH’s struggles on the chart, the flow picture tells a more constructive story. Ethereum spot ETFs have seen inflows extending for the third consecutive day, drawing approximately $115 million on Tuesday, $168 million on Monday and $174 million on Friday. BlackRock’s ETHA ETF outperformed with a total inflow of $199 million, followed by 21Shares’ TETH with $1.62 million. The cumulative inflow stands at $12.79 billion, and net assets at $20 billion.
This divergence between weak price action and steady inflows is worth watching. Persistent institutional demand through spot ETFs can act as a cushion during corrections, absorbing supply from short-term sellers. It does not guarantee a bottom, but it changes the character of a pullback compared with one where both price and flows deteriorate at the same time.
The RSI on the daily chart holds at 61 and is dropping sharply toward the midline, as bullish momentum fades. Failure to push above the moving average cluster between $3,307 and $3,352 could keep ETH under pressure. The 50-day EMA is in line to provide support at $3,132 and prevent the down leg from extending below $3,000.
The MACD indicator still suggests that buyers have a slight edge over sellers, but the green histogram bars need to continue to expand above the mean line to support Ethereum’s bullish thesis. If the histogram starts contracting instead, it would confirm that the fading momentum visible on the RSI is spreading to trend-following signals as well.
Key Data Comparison
| Metric | Current (January 19, 2026) | Previous Month (December 2025) | Year Ago (January 2025) |
|---|---|---|---|
| Bitcoin Price (BTC) | $92,961 | $95,000 | $45,000 |
| Ethereum Price (ETH) | $3,207 | $3,300 | $2,200 |
| XRP Price | $1.97 | $2.10 | $0.80 |
| Total Crypto Market Cap | $3.14T | $3.20T | $1.70T |
The month-over-month softness across all three majors is visible in the table, yet each asset still trades far above its level from a year earlier. That longer view matters when interpreting a correction: the current pullback is unfolding within a market that has expanded substantially over the past year, not one in structural retreat.
XRP Price Forecast: XRP Faces Intensified Selling Pressure
XRP is facing intensified selling pressure, trimming gains as it trades below a multi-month trendline. Bears are pushing to close below the 100-day EMA at $2.23 after bullish exhaustion near a multi-month trendline from the record high of $3.66. The 200-day EMA also served as strong resistance at $2.35, adding to the ongoing headwinds.
XRP ETFs saw inflows of approximately $19 million on Tuesday, marking a significant step down from the $46 million recorded on Monday. Despite the decline in volume, interest in US-listed XRP ETFs has steadied since their debut in November, boosting cumulative inflows to $1.25 billion and related net assets to $1.62 billion.
The RSI has corrected from overbought territory to 64 on the daily chart, which indicates fading bullish momentum. A close below the 100-day EMA would result in a spike in risk-off sentiment, leaving XRP vulnerable to overhead pressure. The 50-day EMA holds at $2.07, which could absorb the selling pressure and prevent an extended correction below $2.00.
For XRP holders, the structure is straightforward: the token is caught between a trendline it failed to break above and a shelf of moving-average support below. How price behaves around the 50-day EMA will likely determine whether this remains an orderly consolidation or deepens into a broader retracement.
Bitcoin ETF vs. Gold ETF: A Performance Comparison
The recent volatility in the cryptocurrency market prompts a comparison with traditional safe-haven assets, particularly gold. While Bitcoin ETFs have attracted significant capital, gold’s performance remains a benchmark for stability during geopolitical and economic uncertainty. Understanding how these assets respond to market events is crucial for portfolio diversification.
During periods of heightened risk sentiment, such as escalations in the trade war or unexpected policy decisions, investors often flock to gold, driving its price to record highs. In contrast, Bitcoin’s price action tends to be more volatile, influenced by factors such as ETF flows, regulatory news, and shifts in market sentiment. Comparing Bitcoin’s performance against other asset classes such as Gold and the Nasdaq 100 shows a more volatile picture.
For investors, the point is not that one asset is superior. Gold’s appeal rests on its reputation for stability when uncertainty spikes; Bitcoin’s appeal rests on its growth potential and expanding institutional access through ETFs, at the cost of sharper drawdowns. A portfolio holding both is making a deliberate trade-off between stability and growth, and volatile sessions like this one illustrate exactly where each side of that trade-off shows up.
Analyzing Key Market Data: Cryptocurrency Market Cap
The total crypto market cap provides a bird’s-eye view of the entire cryptocurrency industry. While Bitcoin and Ethereum remain dominant players, alternative cryptocurrencies (altcoins) such as XRP and Solana are gaining traction. The total crypto market continues to be shaped by traditional financial markets, including the equity markets, as highlighted by the Nasdaq 100.
Examining market capitalization trends can help investors identify potential opportunities and manage risk, and part of that discipline is comparing current readings with earlier figures rather than reacting to a single day’s move. In 2025, XRP investment products absorbed $3.69 billion, a roughly five-fold increase from the $608 million seen in 2024. Solana’s ascent was even steeper, attracting $3.56 billion compared to just $310 million a year earlier, a tenfold expansion.
Those flow figures help explain why altcoin price action has become so sensitive to sentiment around listed products. When investment vehicles concentrate that much new demand, shifts in the pace of inflows can matter for prices in both directions, and the day-to-day ETF flow data covered above becomes a market signal in its own right.
Macroeconomic Factors: Tariff and Rate Cut Impact
Escalating tariff concerns and uncertainty around rate cut expectations are contributing to the recent market volatility. The prospect of a Fed rate cut has been a key driver of bullish sentiment, but any indication of a delay or reversal can trigger a sharp correction. Similarly, escalating trade war fears can dampen risk appetite, leading to a sell-off across risk assets, including cryptocurrencies.
Recent reports suggest that institutional demand via spot ETFs and listed products remained the core structural driver of Bitcoin’s trajectory. There is evidence that policy changes, ETF flows, and regulatory clarity can affect recent prices. In addition, it is essential to note that the market makers of ETFs smooth some of the extreme trading volatility.
The practical implication is that crypto no longer trades in isolation. Watching macro catalysts — central bank communication, tariff headlines, and the tone of equity markets — has become as important as reading the charts, because those forces help set the risk appetite that determines whether support levels hold.
Liquidations and Market Structure: Understanding the Ripple Effects
The recent $800 million in liquidations highlights the leveraged nature of the cryptocurrency market. When prices decline, highly leveraged positions are automatically liquidated, exacerbating the downward pressure and triggering a cascade effect. Understanding market structure is crucial for managing risk and avoiding potential pitfalls.
The mechanics are worth spelling out. A leveraged position is closed automatically once the market moves against it far enough. That forced closing is itself a sell order, which pushes price down further, which brings the next tier of leveraged positions to their liquidation point. Each wave of forced selling can trigger the next — the ripple effect that turns a moderate decline into a rout.
The total crypto market is often influenced by derivative products. While the presence of derivatives can provide opportunities for hedging and arbitrage, they can also amplify volatility and increase the risk of liquidation. The ability to anticipate and manage these risks is essential for navigating the cryptocurrency market successfully.
How Liquidation Waves Have Ranged in Size
Large liquidation events have become a recurring feature of this market, and totals reported by different outlets — often citing data from CoinGlass — show how widely these episodes vary in scale and composition:
- Stocktwits reported, citing CoinGlass data, $956.33 million in liquidations over 24 hours during one selloff, with Ethereum traders hit for $197.78 million, XRP traders for $114.41 million, and Bitcoin traders for $80.97 million.
- Yahoo Finance reported, citing CoinGlass data, liquidations reaching approximately $933 million across all digital assets in 24 hours, with Bitcoin positions totaling $380 million and Ethereum positions at $239 million.
- Coinpedia reported, citing CoinGlass, that 281,846 traders were liquidated in 24 hours for around $1.71 billion in total losses after a flash crash it described as the market’s biggest since October 2025, wiping out $108 billion in just six minutes.
- Yahoo Finance reported that XRP suffered a brutal 37% flash crash on Saturday, August 22, as roughly $500 million in leveraged long positions were liquidated across the crypto market within minutes, with $1.35 billion in leveraged long positions liquidated during the episode.
- CoinDesk reported a Bitcoin drop that liquidated $500 million in bullish bets in early Asia trading, with Binance, Hyperliquid, and Bybit each seeing over $160 million in liquidations and longs making up almost 90% of the total.
- U.Today reported, citing CoinGlass, a quieter stretch in which liquidations across exchanges amounted to $483.61 million in 24 hours, with XRP’s total at $14.16 million, of which $9.28 million came from long positions and $4.88 million from shorts.
Two things stand out from these reports. First, in several of them long positions accounted for most of the damage, which shows how the market was positioned when prices turned. Second, totals differ between trackers and articles depending on the timestamp and measurement window, so any single liquidation figure is best treated as a snapshot rather than a precise count.
The Future of Crypto ETFs: Beyond Bitcoin and Ethereum
While Bitcoin ETFs and Ethereum ETFs have paved the way for institutional adoption, the future of crypto ETFs extends beyond the market’s dominant assets. The SEC’s approval of generic listing standards for commodity-based trusts opens the door for ETFs tracking a wider range of digital assets. This includes altcoins such as XRP, Solana, and even meme coins.
The expansion of crypto ETFs could attract a new wave of investors and further legitimize the asset class. The XRP products discussed above show what that path can look like in practice: a debut, a period of steadying interest, and a growing base of assets that gives the underlying token a new source of structural demand. Whether other altcoins follow a similar trajectory will depend on regulatory clarity and investor appetite, but the listing framework now exists.
Deep Dive: Market Analysis
The cryptocurrency market is currently exhibiting a blend of cautious optimism and underlying anxiety. While Bitcoin and Ethereum continue to solidify their positions as core holdings, the negative sentiment surrounding the tariff and uncertainty about the market structure bill have created headwinds for altcoins. As a result, investors should closely monitor ETF flows, macroeconomic developments, and regulatory news to navigate these turbulent waters.
The price action suggests that a pullback is more likely in the near term, but a strong rebound could signal a renewed bullish phase. The decline of several prominent crypto prices today suggests bearish market conditions. At the same time, the flow data reviewed above shows that institutional demand has not evaporated: inflows into Ethereum and XRP products continued even as prices retreated, and that tension between selling on exchanges and buying through listed products is one of the defining features of the current market.
In this environment, risk management matters more than prediction. Position sizing approaches such as the 1% rule discussed below, keeping leverage modest, and respecting the support levels outlined in the sections above can do more to protect a portfolio than any single price forecast.
Frequently Asked Questions
How much is $500 dollars in Ethereum worth today?
The value of $500 in Ethereum changes constantly based on the current ETH/USD exchange rate. To find the exact amount of ETH you can purchase for $500, you would need to check a cryptocurrency exchange or conversion tool for the most up-to-date figures. During liquidation-driven volatility, prices can move meaningfully within a single session, so even a recent quote may already be stale.
Will XRP hit $10 in 2025?
Predicting future prices with certainty is impossible. Whether XRP will reach $10 in 2025 depends on various factors, including regulatory developments, adoption rates, and overall market sentiment. Financial analysts have been wrong before, so it is important to do your own research and treat any price target as a scenario rather than a promise.
What is the 1% rule in crypto?
The “1% rule” in crypto is a risk management strategy suggesting that investors should allocate no more than 1% of their total investment portfolio to any single cryptocurrency trade. This strategy aims to limit potential losses while still allowing participation in the upside potential of cryptocurrencies. In a market where liquidation cascades can erase leveraged positions quickly, capping exposure per trade is one of the simplest ways to ensure no single bad day is fatal to a portfolio.
Can XRP reach $1000 after a lawsuit?
Reaching $1000 would require an unprecedented increase in market capitalization, which is highly improbable. The lawsuit’s outcome could significantly impact XRP’s price, but even a favorable ruling is unlikely to propel it to such astronomical levels. However, some financial analysts say it is possible; treat such claims with skepticism and weigh them against the sheer scale of the valuation they imply.
Conclusion
Looking ahead, the cryptocurrency market is poised for continued evolution. The key factors shaping the future landscape include the ongoing development of crypto ETFs, regulatory clarity, and macroeconomic trends. While short-term volatility is likely to persist, the long-term outlook remains positive. In 2025, the market briefly touched $4T, then cooled closer to $3T by year-end.
Successful projects will be the ones with low fees and rapid settlement, and by 2026 the broader consensus is that stablecoins will play a large part in the market. For now, the checklist for navigating weeks like this one is unchanged: watch the ETF flows, respect the moving-average levels outlined above, keep leverage modest, and remember that liquidation cascades are a recurring feature of this market’s structure.