BTC Scalping Strategy Levels: 5-Minute Chart Update
Did you know Bitcoin can change by more than 2% in just five minutes? That happened today before the Jackson Hole meeting. Watching Bitcoin drop to a two-week low changed how I approached scalping today.
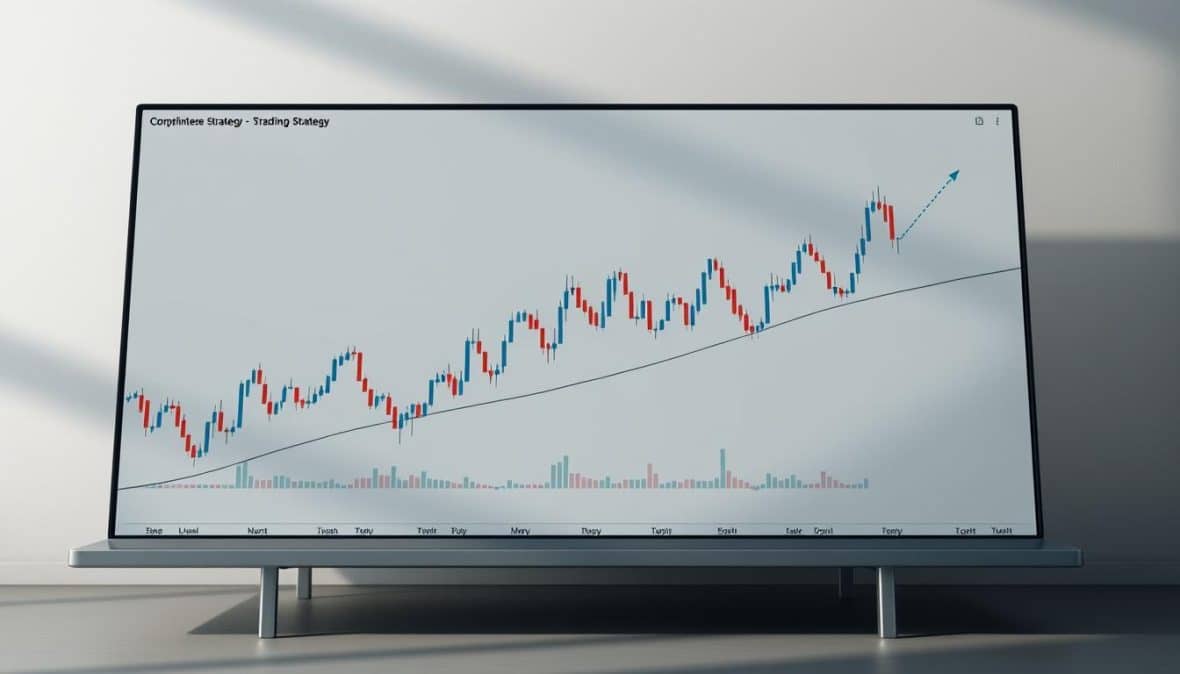
My trading is short-term. I look for levels I can act on right away. Today’s 5-minute chart had notes on important levels, a stats box with recent data, and points where news affected the market.
Big events and news really influence trading. For example, traders sold off their positions when they sensed big changes. This was similar to what happened with XRP. Changes in oil prices and decisions by the Bank of Canada also made me adjust my trading plan.
Key Takeaways
- My 5-minute chart update gives real-time insights on today’s market influenced by big news.
- Short-term trades vary fast due to changes in Fed policies. So, be ready for quick moves.
- I use changes in volume and trading ranges to decide when to enter or exit trades.
- Bitcoin trading can change based on commodity prices and bank decisions, like those from Canada.
- For successful Bitcoin scalping today, use detailed 5-minute charts and have a clear stop plan.
Understanding BTC Scalping Strategies
I trade in short periods, making this advice very hands-on. Scalping is all about securing small profits multiple times a day. Using the 5-minute chart for Bitcoin strikes the perfect balance. It’s quick enough for speedy trades but also broad enough to filter out minor, random price movements.
What is Scalping in Cryptocurrency?
Scalping in cryptocurrency involves making swift buy and sell moves. The aim is to capture tiny changes in price numerous times. By focusing on a 5-minute chart, the goal shifts to gaining small advantages many times over, instead of making a single, large profit.
I keep an eye on major market news even when making small trades. For instance, after the FOMC minutes were released, I observed widespread profit-taking that affected altcoins first. A particular event with XRP and the $300M visible on Coinglass showed how quickly Bitcoin could follow these market moves. Sudden news can turn a potential profit into a loss instantly.
Key Principles of Scalping
Ensuring precise entry and exit points is crucial. I prefer using limit orders and ensuring quick execution to safeguard my tiny profits. Choosing where to trade is guided by market depth since it helps reduce unexpected price changes.
Keeping a tight grip on risk is essential. Each trade is small to minimize risk. I always check the spreads and fees before making a move. I use tools like short moving averages and pinpoint support/resistance levels to decide when to enter a trade.
Advantages of BTC Scalping
Scalping opens up many chances to take advantage of short-term market irregularities. For those into day trading, it means continuous growth without the worries of holding positions overnight. Plus, the financial risk is lower on each trade compared to longer-term plays.
This approach needs quick thinking and sharp focus. I find it especially worthwhile during times of high volatility, like when there are big moves in commodities or central bank announcements. When the market calms down, though, finding profitable opportunities becomes harder.
Chart Analysis Techniques
I spend my mornings looking at the 5-minute chart to understand the market before I trade. I look for patterns showing either an uptrend or downtrend to decide whether to buy or sell. I also pay attention to trading volume and the current position of the intraday VWAP. If the moving averages start to flatten, I get ready for unpredictable prices. But if they spread out, I expect the trend to continue.
Interpreting the 5-Minute View
When I study a 5-minute chart, I focus on three things: price trends, how much volume there is, and the pattern of moving averages. The direction of the price tells me where the market might go. If there’s a lot of volume at the end of a candle, it shows people are interested. Short-term moving averages like the 9 and 21 EMA point out momentum and help me choose the right time to get in.
Big news can shake up the day’s trading trends quickly. I learned this during big events like Jackson Hole speeches and Federal Reserve announcements. These events can make the market move in unexpected ways and even drop to the lowest price in two weeks for currencies like Bitcoin. This taught me to set wider safety nets and to be careful with trades based only on patterns during these big news times.
Recognizing Chart Patterns
I see chart patterns as clues, not promises. Things like triangles, head-and-shoulders, and flat lines are common in short-term trading. I watch XRP closely: it dropped to $3, then jumped to $2.78, showing how important psychological and support levels are.
Look at BTC the same way: if a triangle pattern breaks with a lot of trading volume, it usually moves quickly. Always double-check against other market indicators. Shifts in assets like oil or the Canadian dollar can change the market mood, affecting the strength of these patterns. So, it’s a good idea to look at commodity and currency trends before you decide.
Candlestick Analysis Basics
Candlestick analysis in a 5-minute chart focuses on important candle patterns. Pin bars and engulfing bars are meaningful if they close with high volume. I stay away from signals that don’t have a clear pattern or that don’t follow through after touching the VWAP.
Here’s a simple guide for checking a 5-minute trade idea:
- Structure: looking for clear trend signals
- Trigger candle: needs to be a strong signal like a pin or engulfing candle
- Volume confirmation: should be higher than usual at closing
- Trade plan: should have a clear entry, exit, and goal
| Element | What I Watch | Why It Matters |
|---|---|---|
| Structure | HH/HL vs LH/LH on 5 minute chart | Dictates bias for short-term trading and aligns trade direction |
| Volume | Close-of-candle volume spike | Confirms breakout quality and reduces false breaks |
| VWAP & MAs | VWAP alignment, 9/21 EMA behavior | Shows institutional interest and intraday trend strength |
| Chart Patterns | Triangles, horizontals, rejections | Offers entry/exit zones for scalps using btc scalping strategy levels today 5 minute chart |
| Candles | Pin bars, engulfing bars, volume-confirmed breaks | Provides precise triggers for entries on a 5 minute chart |
Current BTC Price Levels
I’m looking at the 5-minute BTC chart and seeing price patterns around busy areas. The highest price today was near the opening, but it fell to a two-week low. This was because traders sold off ahead of the Jackson Hole meeting. This low matches a spot where lots of selling happened early on.
News stories changed how traders felt about risk. Selling altcoins like XRP and more people taking money out of exchanges often lead to taking profits in cash. I’ve noticed this pattern affects BTC too. When more money comes into exchanges, it usually means more selling will happen soon.
Big picture things are important. What the Federal Reserve says about rates and changes in commodity markets affect how people buy. If the Fed sounds like it might raise rates, riskier assets lose value. This makes the support and resistance levels move lower.
On the 5-minute chart, I mark key supports and resistances to make quick trades better. My notes point out the day’s lowest price and two more support levels. Resistance is at today’s highest price, a special EMA spot on the chart, and price levels where traders usually place their stops.
Where prices level out tells me where the market is balanced. Prices often return to these busy zones quickly after a move. If there’s big news, these areas can change fast. A place that used to be resistance can become support in just an hour.
Along with price, I keep an eye on how much money is moving in and out of exchanges. If I see a lot of money coming in and prices not bouncing back, I trade less or wait. If money is leaving and prices stay above a certain average, I tend to buy and set my stop based on a nearby EMA point.
| Metric | Level / Note | Why It Matters |
|---|---|---|
| Intraday High | $X,XXX — session open resistance | Defines immediate upside cap for scalps; used as profit target |
| Intraday Low | $X,XXX — two-week low alignment | Primary intraday support; traders reduced exposure ahead of Jackson Hole |
| VWAP Low | $X,XXX — intraday value floor | Common stop/entry area for intraday buyers |
| 50/200 EMA Cluster (5-min) | $X,XXX — dynamic resistance/support | Short-term trend filter for scalping entries |
| Most Active Price Zones | $X,XXX–$X,XXX — volume profile nodes | Areas where price consolidates; often see reversals or breakouts |
| Exchange Flow Signal | Inflow spike / outflow spike | Predicts intraday selling or buying; used to adjust risk |
| Macro Influence | Rate expectations & commodity moves | Shifts investor risk appetite and support/resistance placement |
Technical Indicators for Scalping
I scan the 5-minute chart most days, focusing on a few key technical indicators to stay ahead. These short-term tools help me gauge momentum, volatility, and support levels swiftly. This way, I can quickly respond to price movements. I’ll explain how I use each indicator and combine them with price action and volume for solid setups on the 5-minute btc scalping strategy chart.
Moving Averages: Short-Term Trends
On the 5-minute chart, I use exponential moving averages—8, 21, and 50 EMA—to spot short-term trends and setup opportunities. A proper EMA order (8 over 21 over 50) indicates a strong intraday uptrend; a reverse order signals a downtrend. These EMA lines act as moving support and resistance, providing low-risk entry points when paired with volume confirmation.
However, during big market shake-ups, like unexpected Fed announcements, EMAs can become erratic. In such times, these signals are less reliable and need more careful confirmation from the price movements.
RSI for Overbought/Oversold Conditions
I use both a 2-period and a 14-period RSI on the 5-minute chart to spot extreme conditions. The 2-period RSI highlights quick reversal opportunities, while the 14-period provides insight into more sustained momentum shifts. When RSI readings from both timeframes align in either oversold or overbought areas, I look for supportive candle patterns and increasing volume before making a move.
This method reminds me of an event with XRP, where a deeply oversold stochastic preluded a price uptick. Oscillators like the RSI are great for spotting potential rebounds or confirming downtrends, but should not be relied on alone.
Bollinger Bands: Volatility Analysis
By using Bollinger Bands, I can tell when the market might be gearing up for a big move by observing band tightness. When bands tightly compress, it usually means a volatility spike is close, which can lead to a strong intraday trend if the bands then widen. I’m particularly vigilant around major economic announcements, as the first half-hour often sets the market’s direction for the day.
If Bollinger Bands tell a different story than RSI or EMAs, I pause and reassess. A squeeze in the bands, together with EMA support and solid volume, usually signals a strong entry point. But, following significant news, quick band widening can occur, making it tricky to rely solely on these indicators.
Putting It Together
To decide on an entry, I check for EMA alignment or clean crossovers, supportive RSI indicators, and Bollinger Band behavior that matches the anticipated volatility. Price movements and volume must support these signals. This multi-layer strategy helps filter out false alarms during volatile, news-heavy periods. It provides clearer insight for trading on the 5-minute btc scalping strategy chart.
Tools for Effective Scalping
I keep my toolkit simple and effective. Good tools help make quick decisions in fast markets. Here I share the charting software, trading platforms, and data feeds I use for quick setups and btc scalping strategies.
Recommended Charting Software
TradingView is my top choice for its flexible 5-minute setups and unique indicators. It lets me build watchlists and save templates for quick checks.
Bookmap is essential for understanding order flow and market depth. It uncovers details that regular charts don’t show. I use it to confirm my entry points and manage my trades.
Coinigy is great for tracking prices across different exchanges at once. Each tool plays a key role in developing my btc scalping strategies.
Trading Platforms for Scalpers
Fast executions are crucial. I prefer Binance, Coinbase Pro (Advanced Trade), and Kraken for their reliable liquidity and narrow spreads. This reduces slippage during market surges.
It’s important to watch out for fees and API access. I use exchange APIs for automated orders. Strategies like post-only and IOC orders help reduce risk.
Using a reliable VPS close to exchange servers is useful for running bots. For day trading, platforms need to be reliable and have a transparent fee policy.
Real-Time Data and News Sources
Up-to-date information is key for timing entries. I check Coinglass for exchange flows and Santiment for profit and loss trends. They provide insights during market moves.
For big news, I follow Bloomberg, Reuters, and X for updates on the Fed and economy. CoinDesk and CoinTelegraph are my go-tos for crypto news.
Setting up mobile alerts is critical. They give me a heads-up on major events and market shifts. When scalping, timely news can be the key to success.
I pair these tools with strict rules: set btc scalping levels, tight risk management, and minimum indicators. This approach helps me stay focused under pressure.
Developing a Scalping Strategy
I specialize in trading on the 5-minute chart. My method includes how to enter and exit trades, manage risks, and decide the size of positions. It works well during both busy and calm times, especially when Bitcoin has predictable price movements.
Setting Entry and Exit Points
Step 1 involves observing the trend using an EMA stack of 9, 21, and 50. If the 9 is on top, I consider buying. When the order reverses, I think about selling.
For Step 2, I look for a strong indicator candle. This could be a breakout candle or one that retests a support or resistance level. It must have a solid body and significant volume.
Step 3 is about placing a limit order near, but not on, the support or resistance. This improves the chances of a better trade execution and reduces unwanted costs.
In Step 4, I set a tight stop-loss just below the support for buys or above it for sells. I base my stop on previous low or high points, not just a random guess.
To exit, I use a combo of setting profit targets and a trailing stop. Taking some profit at the first minor resistance or support secures some earnings. Then, if the price keeps moving in my favor, I can make more.
Risk Management Techniques
I never risk more than 0.25% to 1% of my total account on a single trade. Sticking to this range prevents one bad trade from ruining multiple successful ones.
It’s crucial to always set stop-losses. I account for the spread and fees in the stop’s placement to ensure my actual risk aligns with my plan. In times of market turmoil, I adapt by adjusting my stops or trade size.
Pay attention to how other cryptocurrencies like XRP or Ethereum might affect Bitcoin. When big events happen, I lower my risks on trades that could be impacted.
Keeping emotions in check is also key. I maintain a trading log to review my decisions. Following a few losses, I take a break. I only trade on big news if I have a specific plan.
Position Sizing Guidelines
To determine how much to trade, I use this formula: risk per trade divided by the stop-loss distance in dollars. It’s vital to convert the stop distance from pips or ticks into dollars first.
Here’s an example: if my account is $50,000 and I risk 0.5%, that’s $250. If my stop distance equals $50, then I can trade 5 contracts or the Bitcoin equivalent.
Adjust position size based on market volatility. For sessions with more movement, like when London and New York markets overlap, I trade smaller amounts. This keeps my risk level steady even if I have to set wider stops.
To wrap up, it’s helpful to log every trade detailing entry, exit, risk, position size, and how I felt. Keeping such records fine-tunes my strategy. It keeps me disciplined in developing a successful scalping strategy for trading Bitcoin.
Predicting Future BTC Movements
I watch price action closely and mix technical analysis from the 5-minute chart with macro cues. This approach helps predict BTC movements. It provides a short-term prediction framework that traders can use.
I monitor market trends and sentiment analysis from various sources. Metrics like those from Santiment show when holders are making profits. Coinglass helps identify selling pressure through exchange inflows and outflows.
These sentiment indicators often point to future price moves. An increase in exchange inflows and higher profits usually mean a price drop is coming. Open interest is also key. A rise in open interest with inflows often leads to more volatility.
Economic indicators quickly change trader’s risk feelings. Things like Fed minutes, CPI data, and big speeches can sway prices within a day. Bitcoin trading gets more restricted when rates are expected to rise.
Economic indicators guide the direction of trades. A tough stance from the Fed usually pushes prices to support levels. But a softer approach can increase price ranges, aiming for higher peaks.
I use a checklist for short-term trading predictions:
- Verify 5-minute technical levels before trading.
- Check sentiment analysis, including profits, exchange flows, and social chatter.
- Be aware of upcoming economic announcements that could shift market direction.
- Keep an eye on open interest for signs of volatility.
Planning for different scenarios simplifies decision-making. Expect tighter ranges if the Fed is firm. But if it’s lenient, anticipate reaching for higher levels and possibly breaking resistance.
Experts combine these insights for quick strategies. They enter trades based on the 5-minute chart and let the macro situation guide their decisions on where to stop and how much to trade. This strategy balances technical detail with broader market movements, avoiding excessive trading.
FAQs on BTC Scalping
I keep a short FAQ here for common questions about btc scalping strategy levels today on a 5-minute chart. These notes are based on my live trading during U.S. hours. They also come from lessons learned by looking at order flow, macro calendars, and trade logs.
What is the Best Time to Scalpel BTC?
The best time for me is when major trading sessions overlap and there’s a lot of trading happening. I like trading the U.S. session because the market spread and volume are predictable. But, it’s important to be careful around big news events.
For instance, Federal Reserve talks and FOMC minutes can suddenly cause traders to take profits. If I do trade during these times, I trade smaller amounts and set very strict stop losses.
How Much Do I Need to Start Scalping?
You can start with any amount, but remember that fees and how much you’re willing to risk per trade matter. Factor in exchange minimums and a little extra, to risk about 0.25–1% per trade. This approach accounts for stop losses and transaction fees on platforms like Binance, Coinbase Pro, or Kraken.
Using leverage? Be extra careful. Leverage can quickly increase both your gains and losses.
Is Scalping Suitable for Beginners?
Scalping is challenging. It requires you to be disciplined, make quick decisions, and manage your emotions well. I suggest beginners practice with virtual trading or very small amounts of money. It’s important to understand order flow and what drives market movements before you start investing more.
Here’s a quick checklist I follow:
- Start with a demo account or very small trades.
- Keep a detailed record of all your trades.
- Use a fast exchange and dependable charts.
- Know the best times for scalping BTC and avoid risky times like FOMC decisions.
Evidence and Statistics Behind Scalping Strategies
I keep a close eye on data during bitcoin scalping sessions. I use on-chain signals from Santiment and exchange flows from Coinglass to get an edge. This blend provides solid evidence and helps filter out the noise.
Success Rates of BTC Scalpers
Success rates for BTC scalpers vary widely. There isn’t one number that fits all traders. My records show that traders who win 55–70% of the time can make money if they manage their risk and size of trades well.
Watching your win rate, your average risk-reward, and what you expect to win is crucial. In scalping, it’s common to see high win rates with small gains. But the expectancy of your trades is what really matters. You should use stats to avoid getting tricked by short-term luck.
Performance Metrics to Consider
It’s key to look at your win rate, average gain or loss, expected value per trade, maximum drop, and how often you trade. To compare strategies, I like to calculate ratios similar to the Sharpe ratio for different sessions.
Keeping transaction costs low and executing trades tightly boosts these metrics. Before putting real money on the line, I do short tests to see how much slippage and fees will affect me.
Reviewing Historical Scalping Data
Looking at old scalping data shows certain days that were wildly different because of big news like Fed policy changes. Those days made the usual patterns of ups and downs change for a couple of weeks.
I make sure to consider those big news events in my tests so I don’t get fooled by them. If you don’t account for these kinds of unusual days, your averages could end up not really reflecting what’s typical.
Here’s a quick look at some important numbers I keep an eye on to judge strategies. They show what you might expect in a normal scalping session and help set realistic expectations.
| Metric | Typical Range | Why It Matters |
|---|---|---|
| Win Rate | 50%–75% | Shows frequency of profitable trades; must be paired with risk-reward |
| Average Gain / Loss (R) | 0.2R – 1.0R | Reflects that many scalpers take small profits and larger stop discipline |
| Expected Value per Trade | 0.001R – 0.02R | Captures long-run profit potential after fees and slippage |
| Max Drawdown | 2%–12% (account) | Critical for risk management and psychological resilience |
| Trade Frequency | 10–80 trades/day | Impacts fee load and data requirements for robust statistics |
Case Studies of Successful Scalpers
I keep an eye on several public traders who share their daily trades on TradingView and Twitter. These traders’ stories help us see the importance of having disciplined routines and clear risk management rules. By sharing my observations, I explain how they react to market changes in real time.
Profiles of notable scalpers
We should look at traders who openly share their profits, losses, and trade screenshots. They often stick to a specific strategy that involves small profit goals, tight stop losses, and a plan before the trading session begins. These stories underline their common qualities: discipline, having a competitive edge, making quick decisions, and actively managing risks. Following educators who share detailed trading insights helps me understand effective tactics for short-term trades.
Strategies used by successful traders
Breakout scalping works best during big market moves that drive momentum. These traders catch the initial movements and exit when the momentum fades. When prices move sideways, mean-reversion trades around the VWAP indicator are common. Using order-flow information helps them predict short-term price movements. They rely on understanding market behavior like profit-taking and investor inflows, which are key to making money with a 5-minute btc scalping strategy.
Lessons learned from their experiences
It’s important to keep a close watch on the news. Once, avoiding trading during a major event saved my capital. It’s crucial to understand market liquidity and adjust your trade sizes accordingly. Keeping a trade journal helps identify mistakes quicker than seeking advice online. These are common insights from traders who have managed to stay profitable.
Here’s a quick overview of the strategies and outcomes from the traders I monitor.
| Approach | Typical Setup | Edge | Key Risk Control |
|---|---|---|---|
| Breakout Scalping | Momentum candle break + volume spike on 5-min | First-mover advantage on macro spikes | Stop at session pivot; small position size |
| VWAP Mean-Reversion | Price deviation from VWAP during calm hours | High probability reversion after profit-taking | Time-based exit; scale into fade |
| Order-Flow Scalping | Imbalance in depth, large prints against trend | Reads real supply/demand in real time | Immediate micro-stop; limit exposure per print |
Case studies remind us that no one method always wins. Successful scalpers mix strategies, respond to changing markets, and continually improve their methods. My experience tracking public trades helps me better understand the btc scalping strategy and share more effective trading tips.
Final Thoughts on BTC Scalping
I’ll wrap up with tips you can use at the trading desk. Let’s talk about what to look for in the 5-minute chart. Focus on small, repeatable trades.
Summary of Key Points
Keep an eye on the 5-minute chart structure. Look at short EMAs for trend direction, RSI for market exhaustion, and Bollinger Bands for volatility. Don’t jump in unless volume backs the move.
Use Santiment and Coinglass to avoid false signals. And remember, big economic news and events should guide your trading plans.
Future Outlook for Scalping BTC
The scalping strategy will remain useful, but you’ll need to watch the economy more. Expect tighter trade margins if central banks stay strict. If the market turns optimistic, brace for more movement and chances to scalp.
Final Recommendations for Traders
Limit your risk per trade and stick to a reliable setup. Test your strategy with various data, including Fed minutes. And don’t make blind trades around big news events.
Make a pre-trade checklist to review EMAs, RSI, Bollinger Bands, volume, and on-chain activity. This will help protect your investment.
I’ll adjust my strategies based on the latest Fed news. Stay flexible, monitor the btc scalping strategy levels today 5 minute chart, and treat these tips as flexible guidelines that evolve with the market.
Additional Resources and Guides
I’ve gathered a list of helpful tools that I use for trading on the 5-minute chart. These tools include order-flow instruments, metrics of exchange flow, and clear tutorials. You can quickly test setups with them and feel more sure about your choices.
Links to Detailed Scalping Guides
TradingView tutorials are perfect for learning 5-minute setups and chart scripting. For order-flow practice, Bookmap’s resources are top-notch. If you need data on exchange flow or to check the pressure from profit-taking, look at Coinglass and Santiment. They’re what I use.
Recommended Reading on Cryptocurrency Trading
To dive deeper, read about market microstructure and intraday trading tactics. These should include thoughts on psychology and how to manage risks. Combine this knowledge with updates from places like FOMC minutes and central bank announcements. CoinDesk is also good for staying updated, like with reports on BTC’s recent performances.
Online Communities for Scalpers
Join communities like TradingView, Reddit’s r/BitcoinMarkets, and Discord groups for live trading ideas and advice. Follow traders on Twitter/X who share 5-minute market breakdowns. These communities, along with the guides and readings I mentioned, will make learning to scalp easier.